Showing posts with label MRI. Show all posts
Imaging grey matter atrophy to find the roots of disability

Imaging grey matter atrophy to find the roots of disability

How do we measure nerve loss?

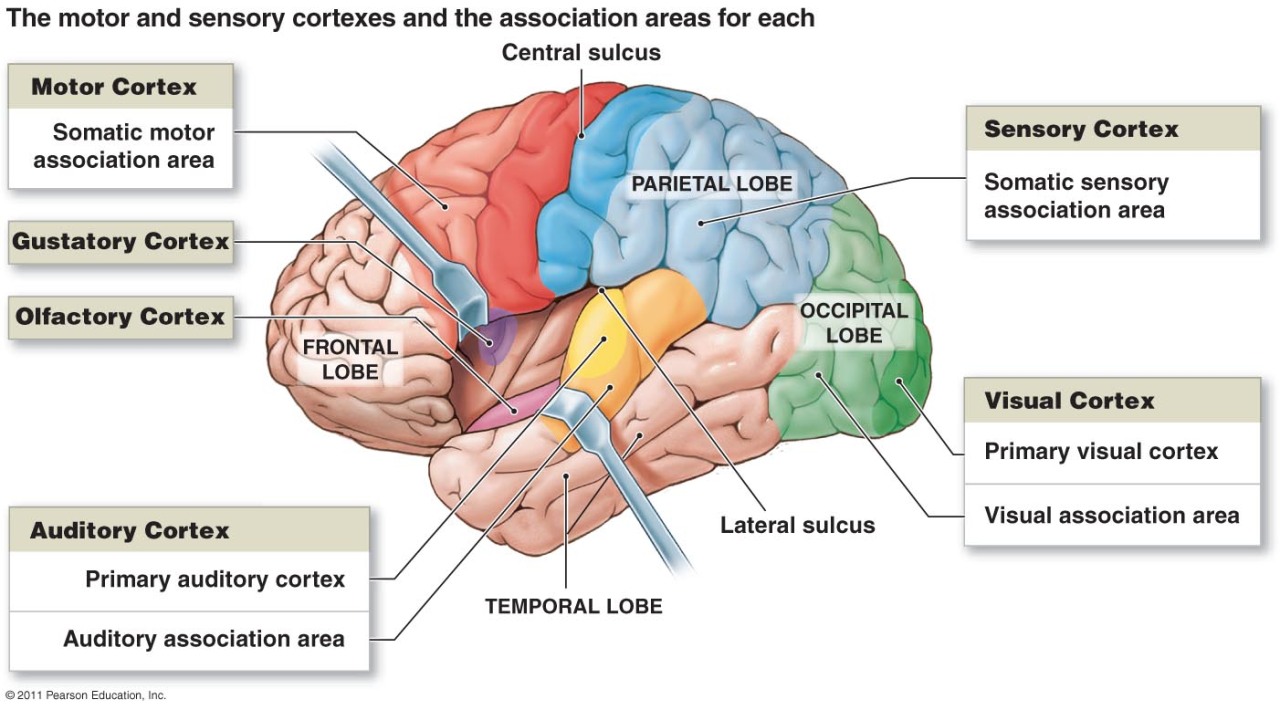
The imagers tell us it is grey matter loss that holds the key.

So what's new here?

About ten years ago I was at a meeting where a very distinguished MRI expert was saying that 'whole brain volume' was not a good outcome measure to monitor progression and that grey matter volume was a much more responsive outcome measure.

However, we (the neuros should I say) have continued to use whole brain atrophy as an outcome measure, and trials have failed, over and over again. 

The white matter may swell due to the inflammatory activity and shrink when the immune response goes. 

This study suggests that grey matter loss best correlates with disability. So when will people start to listen?

High-dose biotin made the brain shrink and the EMA want more data.

Statins slowed the shrinkage, does it mean it is good?

People are using cord shrinkage as an outcome, but again it has problems as we have shown that it may miss a lot of the nerve loss.


Eshaghi A, Prados F, Brownlee W, Altmann DR, Tur C, Cardoso MJ, De Angelis F, van de Pavert SH, Cawley N, De Stefano N, Stromillo ML, Battaglini M, Ruggieri S, Gasperini C, Filippi M, Rocca MA, Rovira A, Sastre-Garriga J, Vrenken H, Leurs CE, Killestein J, Pirpamer L, Enzinger C, Ourselin S, Wheeler-Kingshott CAMG, Chard D, Thompson AJ, Alexander DC, Barkhof F, Ciccarelli O; MAGNIMS study group. Ann Neurol. 2018. doi: 10.1002/ana.25145. [Epub ahead of print]

OBJECTIVE:

Grey matter (GM) atrophy occurs in all multiple sclerosis (MS) phenotypes. We investigated whether there is a spatiotemporal pattern of GM atrophy that is associated with faster disability accumulation in MS.

METHODS:

We analysed 3,604 brain high-resolution T1-weighted MRI scans from 1,417 participants: 1,214 MS patients (253 clinically-isolated syndrome[CIS], 708 relapsing-remitting[RRMS], 128 secondary-progressive[SPMS], 125 primary-progressive[PPMS]), over an average follow-up of 2.41 years (standard deviation[SD]=1.97), and 203 healthy controls (HCs) [average follow-up=1.83 year, SD=1.77], attending 7 European centres. Disability was assessed with the Expanded-Disability Status Scale (EDSS). We obtained volumes of the deep GM (DGM), temporal, frontal, parietal, occipital and cerebellar GM, brainstem and cerebral white matter. The annual percentag was assessed.

RESULTS:

SPMS showed the lowest baseline volumes of cortical GM and DGM. Of all baseline regional volumes, only that of the DGM predicted time-to-EDSS progression (hazard ratio=0.73, 95% CIs 0.65, 0.82; p<0.001): for every standard deviation decrease in baseline DGM volume, the risk of presenting a shorter time to EDSS worsening during follow-up increased by 27%. Of all longitudinal measures, DGM showed the fastest annual rate of atrophy, which was faster in SPMS (-1.45%), PPMS (-1.66%), and RRMS (-1.34%) than CIS (-0.88%) and HCs (-0.94%)[p<0.01]. The rate of temporal GM atrophy in SPMS (-1.21%) was significantly faster than RRMS (-0.76%), CIS (-0.75%), and HCs (-0.51%). Similarly, the rate of parietal GM atrophy in SPMS (-1.24-%) was faster than CIS (-0.63%) and HCs (-0.23%) (all p values <0.05). Only the atrophy rate in DGM in patients was significantly associated with disability accumulation (beta=0.04, p<0.001). 

INTERPRETATION:

This large multi-centre and longitudinal study shows that DGM volume loss drives disability accumulation in MS, and that temporal cortical GM shows accelerated atrophy in SPMS than RRMS. The difference in regional GM atrophy development between phenotypes needs to be taken into account when evaluating treatment effect of therapeutic interventions. 


Imaging Microglia

Imaging Microglia

Although this won't make me popular with the "imagers", here you have it from the horse's mouth "magnetic resonance imaging alone provides limited information for predicting an individual patient's disability progression".

Datta G, Colasanti A, Rabiner EA, Gunn RN, Malik O, Ciccarelli O, Nicholas R, Van Vlierberghe E, Van Hecke W, Searle G, Santos-Ribeiro A, Matthews PM. Neuroinflammation and its relationship to changes in brain volume and white matter lesions in multiple sclerosis. Brain. 2017. doi: 10.1093/brain/awx228. [Epub]

As I have said repeatedly, we have had paper after paper claiming this or that parameter is associated with this or that disability years down the line. I have said many times that the correlations are usually so weak that it is meaningless as a predictor of any individuals course of disease, yet still we get imaging after imaging paper doing just that.

Don't believe me? Here are a few examples:

Petracca M, Sumowski J, Fabian M, Miller A, Lublin F, Inglese M. Looking into cognitive impairment in Primary-Progressive Multiple Sclerosis.Eur J Neurol. 2017. doi: 10.1111/ene.13489. [Epub ahead of print]
Among OCT metrics, only GCIPL was associated with cognitive impairment (rp =.448, p=.036) and predictive of objective cognitive impairment (Wald [1]=4.40, p=.036). Controlling for demographics, normalized brain volume (NBV) and thalamic volume were correlated with GCIPL (respectively rp =.427, p=.047 and rp =.674, p=.001) and cognitive scores (respectively rp =.593, p=.004 and rp =.501, p=.017), with thalamic volume nearly mediating the association between GCIPL and cognition (Sobel z=1.86, p=.063).

If you lose nerves in the eye this is associated with cognitive impairment. Of course the two are not linked, but if you have lost nerves in the eye (in the ganglion cell inner plexiform layer) due to disease activity, you are more likely to have lost nerves elsewhere. The correlations are so weak and those in the thalamus are not significant.

Rocca MA, Sormani MP, Rovaris M, Caputo D, Ghezzi A, Montanari E, Bertolotto A, Laroni A, Bergamaschi R, Martinelli V, Comi G, Filippi M. Long-term disability progression in primary progressive multiple sclerosis: a 15-year study. Brain. 2017. doi: 10.1093/brain/awx250. [Epub].
At 15 years, 90% of the patients had disability progression. Integrating clinical and imaging variables at 15 months predicted disability changes at 15 years better than clinical factors at 5 years (R2 = 61% versus R2 = 57%). The model predicted long-term disability change with a precision within one point in 38 of 49 patients (77.6%). Integration of clinical and imaging measures allows identification of primary progressive multiple sclerosis patients at risk of long-term disease progression 4 years earlier than when using clinical assessment alone.

If you look at disease in 15 months it predicts disability at 15 years, but there is 40% of the problem is not explained, so imaging may give you a risk (which aid in decisions) but at the individual level it can't say what will happen.


Anyway rant over, but it is important that you realize this if you are reading these papers. Interpretation of MRI data is not always "black and white" . Anyway MD3 may want to tell you what the paper said (Datta et al. 2017).

Brain magnetic resonance imaging is an important tool in the diagnosis and monitoring of multiple sclerosis patients. However, magnetic resonance imaging alone provides limited information for predicting an individual patient's disability progression. In part, this is because magnetic resonance imaging lacks sensitivity and specificity for detecting chronic diffuse and multi-focal inflammation mediated by activated microglia/macrophages. The aim of this study was to test for an association between 18 kDa translocator protein brain positron emission tomography signal, which arises largely from microglial activation, and measures of subsequent disease progression in multiple sclerosis patients. Twenty-one patients with multiple sclerosis (seven with secondary progressive disease and 14 with a relapsing remitting disease course) underwent T1- and T2-weighted and magnetization transfer magnetic resonance imaging at baseline and after 1 year. Positron emission tomography scanning with the translocator protein radioligand 11C-PBR28 was performed at baseline. Brain tissue and lesion volumes were segmented from the T1- and T2-weighted magnetic resonance imaging and relative 11C-PBR28 uptake in the normal-appearing white matter was estimated as a distribution volume ratio with respect to a caudate pseudo-reference region. Normal-appearing white matter distribution volume ratio at baseline was correlated with enlarging T2-hyperintense lesion volumes over the subsequent year (ρ = 0.59, P = 0.01). A post hoc analysis showed that this association reflected behaviour in the subgroup of relapsing remitting patients (ρ = 0.74, P = 0.008). By contrast, in the subgroup of secondary progressive patients, microglial activation at baseline was correlated with later progression of brain atrophy (ρ = 0.86, P = 0.04). A regression model including the baseline normal-appearing white matter distribution volume ratio, T2 lesion volume and normal-appearing white matter magnetization transfer ratio for all of the patients combined explained over 90% of the variance in enlarging lesion volume over the subsequent 1 year. Glial activation in white matter assessed by translocator protein PET significantly improves predictions of white matter lesion enlargement in relapsing remitting patients and is associated with greater brain atrophy in secondary progressive disease over a period of short term follow-up.
Does MS affect peripheral nerves?

Does MS affect peripheral nerves?

There are few things that all MSologists agree on. 

Perhaps one of the least controversial statements you can make about MS is that it is a disease of the Central Nervous System - i.e. the brain, brainstem, cerebellum, and spinal cord - and that it does not affect the peripheral nerves.


Plus ca change.


A new study from Heidelberg has questioned the dogma that MS does not affect peripheral nerves. Although this idea has been floated in the past, hard proof for it has been lacking. Kollmer and co. recruited 36 pwMS and 35 healthy controls with a similar age and gender distribution. After some careful questioning to exclude other causes of peripheral nerve damage, they assessed the function of the participants' peripheral nerves in two ways: Nerve conduction studies (NCS), and MRI. 

Using these two techniques, they asked whether there is any evidence that pwMS accrue demyelinating lesions of peripheral nerves akin to CNS lesions.


They found no strong evidence of demyelination on NCS in either pwMS or controls. 


However, they found that pwMS had significant more hyperintense lesions on T2-MRI in their peripheral nerves than controls. These changes are not readily explained by compression of the spinal nerve roots, the presence of spinal cord lesions, or disease-modifying therapy as there was no clear relationship with any of these factors. Interestingly, nerve width was also increased in pwMS for large nerves compared to controls, but there was no such difference in smaller, terminal branches. 


These findings are incredibly interesting.


It is worth noting that the healthy controls had quite a few lesions, implying that using MRI may pick up very subtle disturbances of peripheral nerve myelin which don't have any functional importance. Importantly, the peripheral nerve lesions were not associated with abnormalities of nerve conduction. This means that the functional significance of these lesions is unclear at this stage. It would be useful to know how these people fare in the long-term to see whether these subtle MRI changes pre-empt frank disturbances of peripheral nerve conduction. 


It is also unclear what causes these abnormalities. Some possibilities are...

- Inflammatory demyelination of the peripheral nerves is part and parcel of the same process that affects the CNS in MS;
- CNS damage (lesions/atrophy/both) leads to demyelination of peripheral nerves;
- An unknown genetic/enviromental factor predisposes to MS and demyelinating peripheral nerve damage.

Regardless of the cause, I think the lack of concordant MRI and NCS suggests that the lesions picked up here are very subtle and may be epiphenomenon. That said, if this result can be followed-up with more definitive evidence of demyelination - such as biopsy evidence - it will require us to radically rethink our view of MS biology. If MS really does affect peripheral nerves this will not only have far-reaching implications for our understanding of the disease but will open up lots of new avenues for diagnosing and predicting MS. 


***

Abstract:

Objective:To detect and quantify peripheral nerve lesions in multiple sclerosis (MS) by magnetic resonance neurography (MRN).

Methods: 36 patients diagnosed with MS based on the 2010 McDonald criteria (34 with the relapsing-remitting form, 2 with clinically isolated syndrome) with and without disease modifying treatment were compared to 35 healthy age/sex-matched volunteers. All patients underwent detailed neurological and electrophysiological examinations. 3T MRN with large anatomical coverage of both legs and the lumbosacral plexus was performed by using 2D fat-saturated, T2-weighted and dual echo turbo-spin-echo sequences as well as a 3D T2-weighted, fat-saturated SPACE sequence. Besides qualitative visual nerve assessment, a T2w-signal quantification was performed by calculation of proton-spin-density and T2-relaxation time. Nerve diameter was measured as a morphometric criterion.

Results:T2w-hyperintense nerve lesions were detectable in all MS patients with a mean lesion number at thigh level of 151.5±5.7 vs. 19.1±2.4 in controls (p<0.0001). Nerve proton-spin-density was higher in MS (tibial/peroneal: 371.8±7.7/368.9±8.2) vs. controls (tibial/peroneal: 266.0±11.0/276.8±9.7;p<0.0001). In contrast, T2-relaxation time was significantly higher in controls (tibial/peroneal:82.0±2.1/78.3±1.7) vs. MS (tibial/peroneal:64.3±1.0/61.2±0.9; p<0.0001). Proximal tibial and peroneal nerve caliber was higher in MS (tibial:52.4±2.1mm2; peroneal:25.4±1.3mm2) vs. controls (tibial:45.2±1.4mm2; p<0.0015; peroneal:21.3±0.7mm2; p=0.0049).

Interpretation:Peripheral nerve lesions could be visualized and quantified in MS in vivo by high resolution MRN. Lesions are defined by an increase of proton-spin-density and a decrease of T2-relaxation time, indicating changes in the microstructural organization of the extracellular matrix in peripheral nerve tissue in MS. By showing involvement of the peripheral nervous system in MS, this proof-of-concept study may offer new insights into the pathophysiology and treatment of MS. This article is protected by copyright. All rights reserved.
Plot thickens: McDonald criteria for MS

Plot thickens: McDonald criteria for MS

Interested in reading about a Catch-22?


Eur J Neurol. 2017 Oct 11. doi: 10.1111/ene.13476. [Epub ahead of print]

Low clinical conversion rate in clinically isolated syndrome (CIS) patients - diagnostic benefit of McDonald 2010 criteria?

Rosenkranz SC, Kaulen B, Neuhaus A, Siemonsen S, Köpke S, Daumer M, Stellmann JP, Heesen C.

Abstract

BACKGROUND:

New diagnostic criteria of Multiple Sclerosis (MS) increase the number of patients being diagnosed with MS while a substantial part might not convert to clinically definite MS (CDMS).

OBJECTIVE:

Diagnostic accuracy of the McDonald 2005 and 2010 criteria for conversion to CDMS was evaluated in an unselected cohort of patients in whom a MS diagnostic workup was decided.

METHODS:

We analyzed clinical, MRI and CSF data in all patients who presented with symptoms suspicious for MS at the University based MS outpatient clinic between 2006 and 2010 (n=165).

RESULTS:

Follow-up was available for 131 patients. During the mean follow-up period of 2 years, 19% of patients developed clinically definite multiple sclerosis (CDMS) whereas 64% of the patients fulfilling McDonald2010 criteria did not convert to CDMS.

CONCLUSION: The low clinical conversion rate indicates that new diagnostic criteria may increase the incidence of MS cases with a less active disease course.


If 2016 was the year to end all years, 2017 is surely the year of activists and dissidents. On balance, destabilization is a good thing; I like others feel science has followed the views of the majority for far too long.

“In questions of science, the authority of a thousand is not worth the humble reasoning of a single individual.”
                                                     ― Galileo Galilei

Recently, I posted on the value of CSF analysis in MS; a procedure, which if we're not careful may disappear altogether in MS. Rosenkranz et al. in their publication also question whether the science/neurology community were too precipitous in our blind reliance of the MRI diagnostic criteria in suspected MS cases?

There are a number of MRI criteria in practice, they all vary in their sensitivity (ability to correctly identify those with the disease) and specificity (ability to correctly identify those without the disease). But, what is apparent is that through the years the various iterations have improved sensitivity substantially, but at the cost of ever decreasing specificity. Not surprisingly, the authors state that 'the validity for MRI as a diagnostic and prognostic tool is a matter of ongoing discussion'.

In their study, Rosenkranz et al. identified 131 individuals with initial presentation of demyelination (clinically isolated syndrome, CIS). During the follow-up period of 2 years, 19% developed clinically definite MS based on the Poser criteria (click on the hyperlink of CSF analysis in MS to view this criteria). Conversely, 45% fulfilled the 2010 McDonald criteria (this figure was lower when the 2005 criteria was applied). In short, the 2010 criteria lead to more MS diagnosis at the CIS stage, including those who do not then go onto experience further clinical events!

The catch-22 of this scenario is that we don't truly know the long term prognosis/outcomes of these individuals. How can we then judge whether there is harm from early treatment or if there are long-term benefits to be had? I'm conflicted in all of this as I am an early treatment advocate and believe in pushing the boundaries.